top of page
Urban Analytics: Sentiment, Mobility & Urban Behavior
This project collection explores how computational methods can reveal relationships between public perception, human behavior, and urban environments.
The primary case study, completed with a three-person team and recognized as a top project in the course, examined whether positive sentiment toward Atlanta parks is associated with greater visitation to nearby businesses and other points of interest. We combined park boundaries, mobility-based POI visitation data, Google Maps reviews, Census indicators, transportation access, built-environment characteristics, and seasonal observations to study how perceptions of public space may relate to surrounding urban activity.
The project progressed from spatial sampling and web-based review collection to NLP sentiment classification and multivariate statistical modeling. The final R workflow used negative binomial regression, model comparison, seasonal analysis, and industry-specific models while controlling for factors including Walk Score, transit access, crime, street-network characteristics, household income, population and job density, poverty, demographics, and park size.
A second independent case study applies R-based text and sentiment analysis to online discourse about women serving in the U.S. military, demonstrating how similar computational methods can be applied to broader social and policy questions.
Project type
Urban Analytics & R Programming
Date
Fall 2026
Location
Atlanta, Georgia
Tools & Skills
R • Urban Analytics • Sentiment Analysis • Natural Language Processing • Mobility Data • Google Reviews • Web Scraping • Spatial Analysis • Negative Binomial Regression • Model Comparison • Seasonal Analysis • Built Environment • Human Behavior • Data Visualization
Team
Zhaoxin “Jenny” Ma • Kasturi Palit • Sung Ho Synn; Three-person Georgia Tech Urban Analytics team. The project was recognized as one of the strongest projects in the class.

01
Urban Analytics: Sentiment, Mobility & Urban Behavior

01
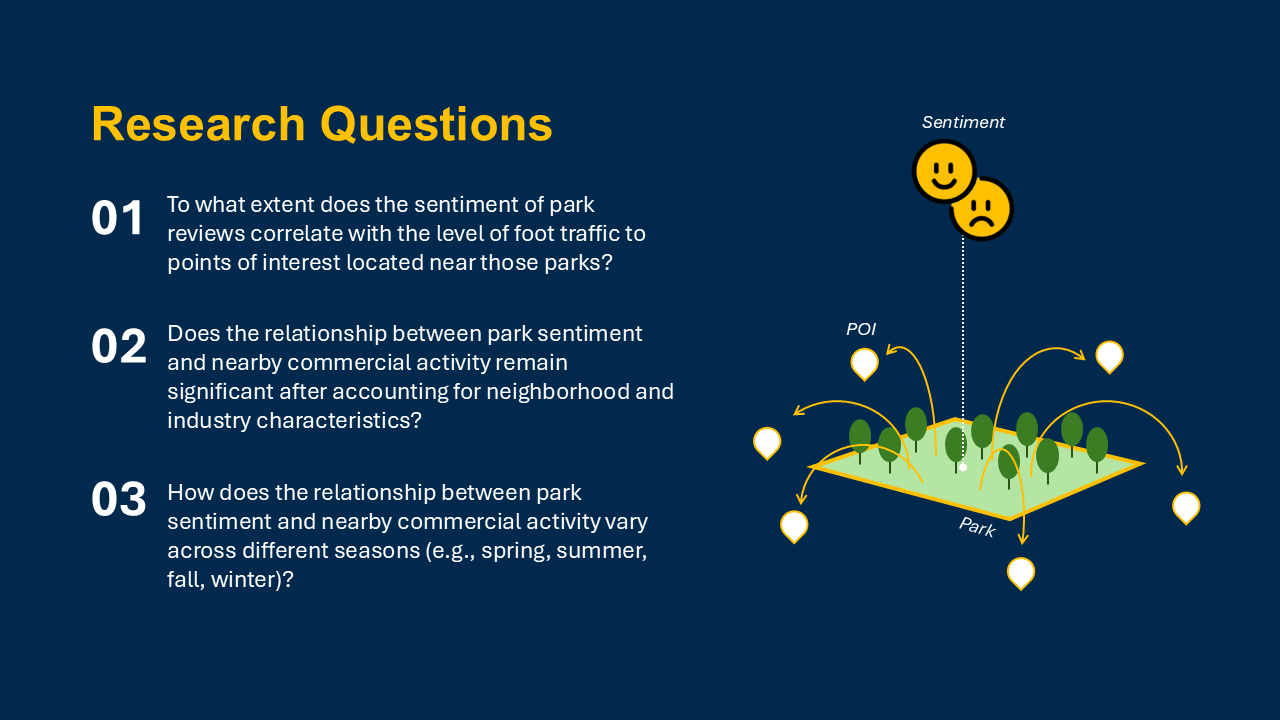
Research Questions
Urban Analytics project exploring whether positive sentiment toward Atlanta parks is associated with higher visitation to nearby businesses and other points of interest.
The study asked whether park sentiment correlates with nearby foot traffic, whether the relationship remains after controlling for neighborhood and industry characteristics, and whether it changes across seasons.
The study asked whether park sentiment correlates with nearby foot traffic, whether the relationship remains after controlling for neighborhood and industry characteristics, and whether it changes across seasons.

02
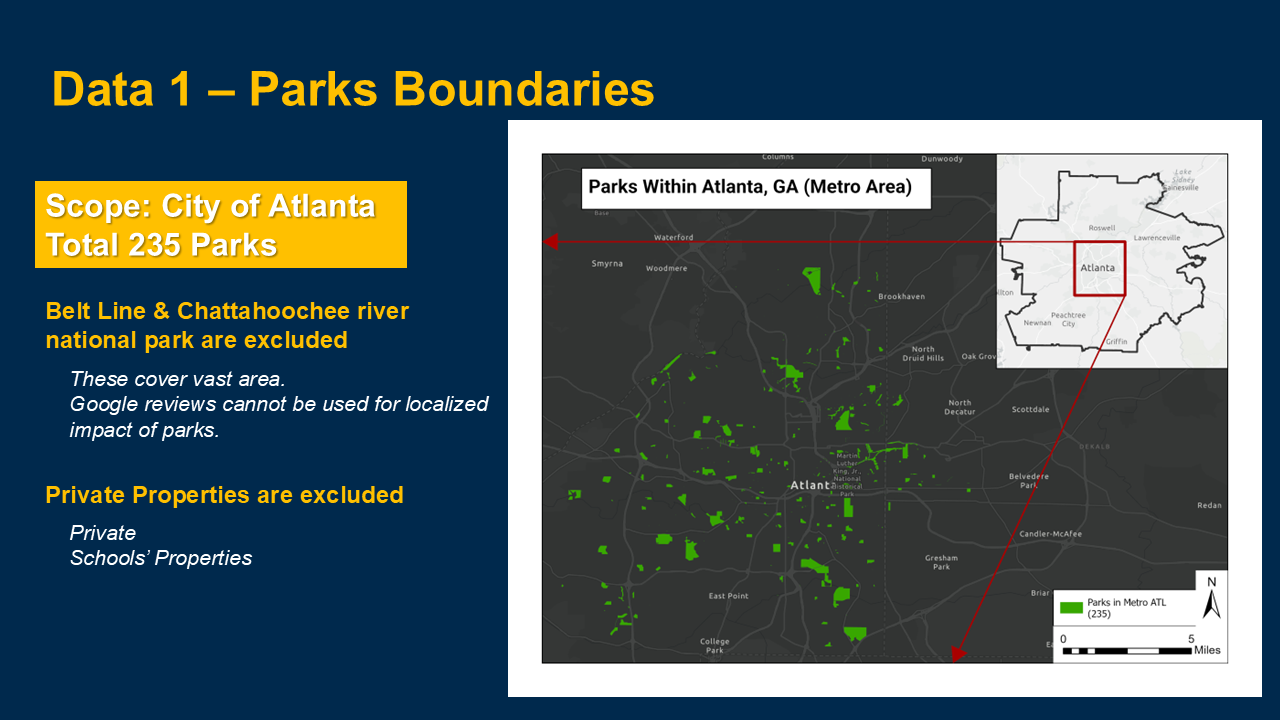
Atlanta Park Study Area
Defined the study area using 235 Atlanta parks while excluding large linear and regional systems whose scale and function could complicate localized park-impact analysis.

03
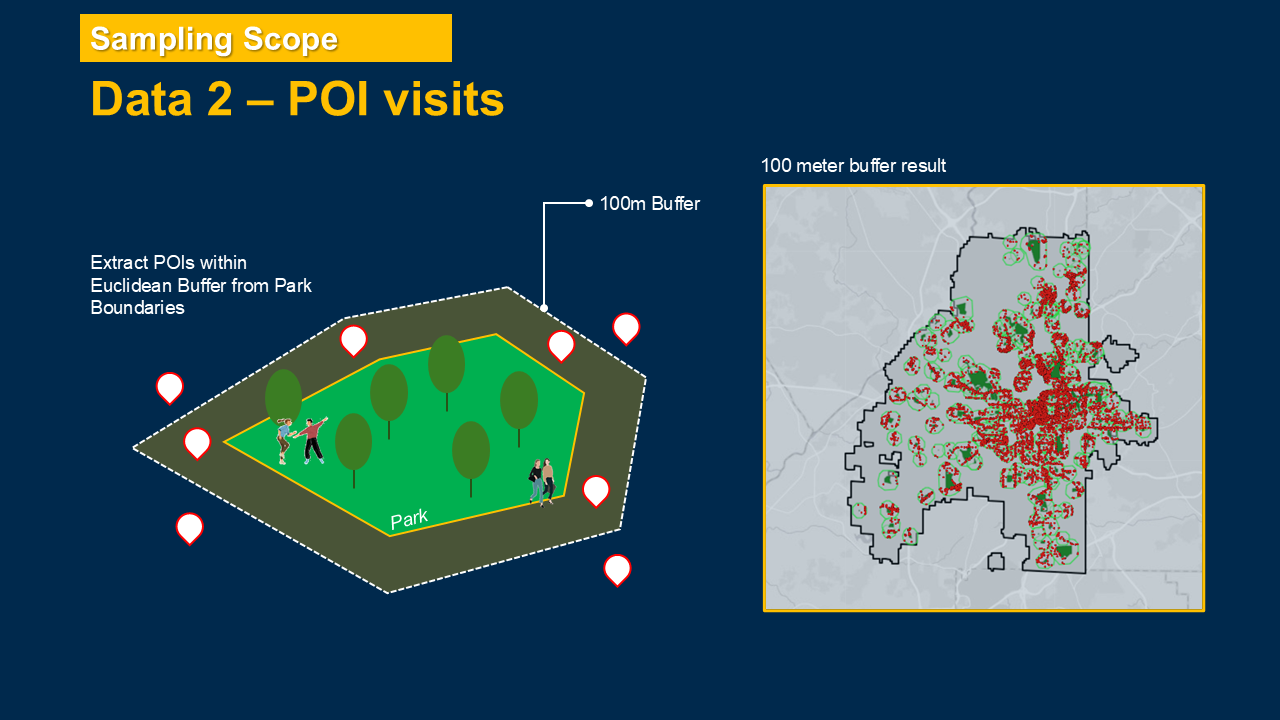
Spatial Sampling of Nearby Points of Interest
Created buffers around park boundaries to identify nearby POIs and connect park characteristics with surrounding commercial and social activity.

04
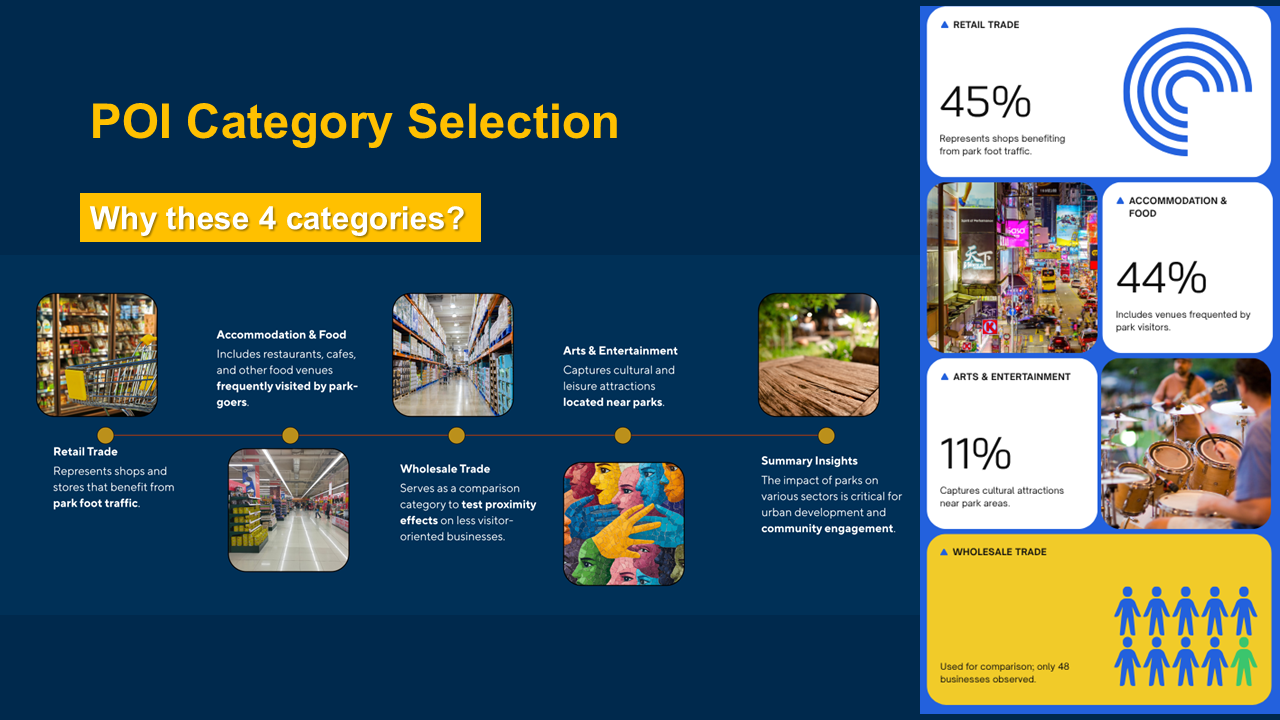
Selecting Visitor-Oriented Business Categories
Focused the analysis on retail, accommodation and food services, arts and entertainment, and a comparison category to test whether park-related effects differ across industries.

05
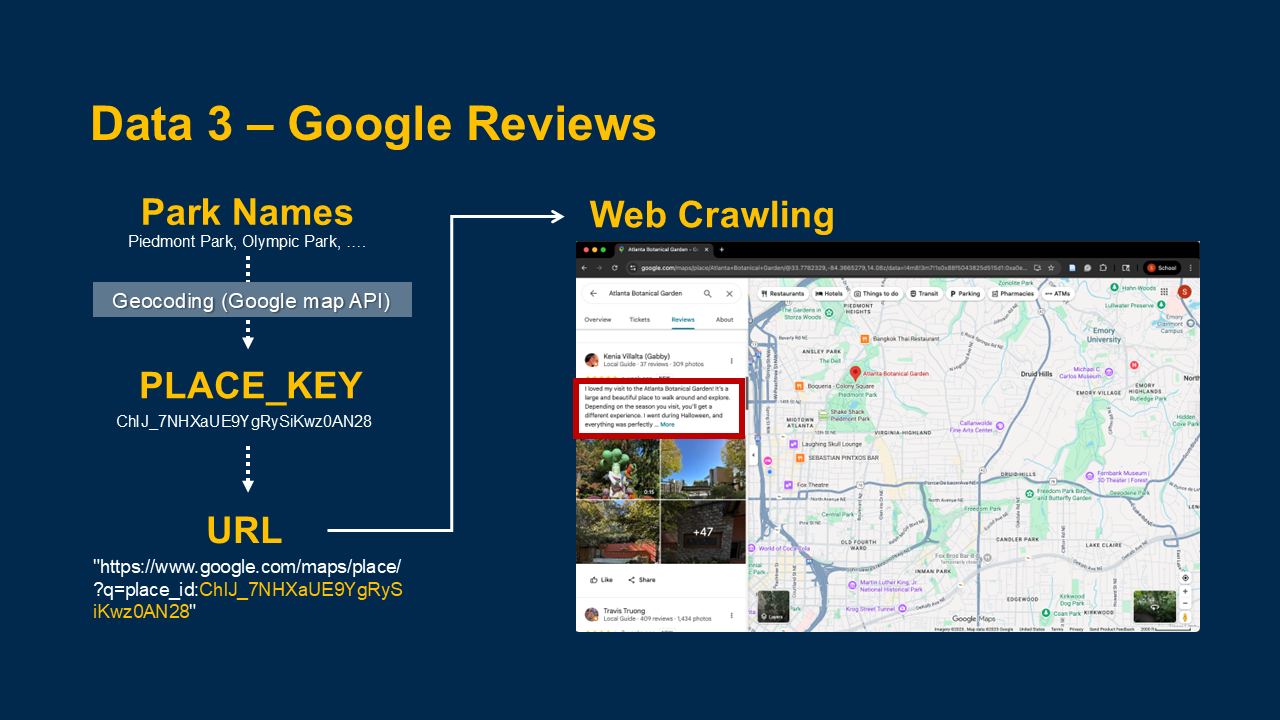
Google Review Collection
Used park names and Google place identifiers to build a review-collection workflow for Atlanta parks, expanding beyond the small number of reviews available through the standard API.

06
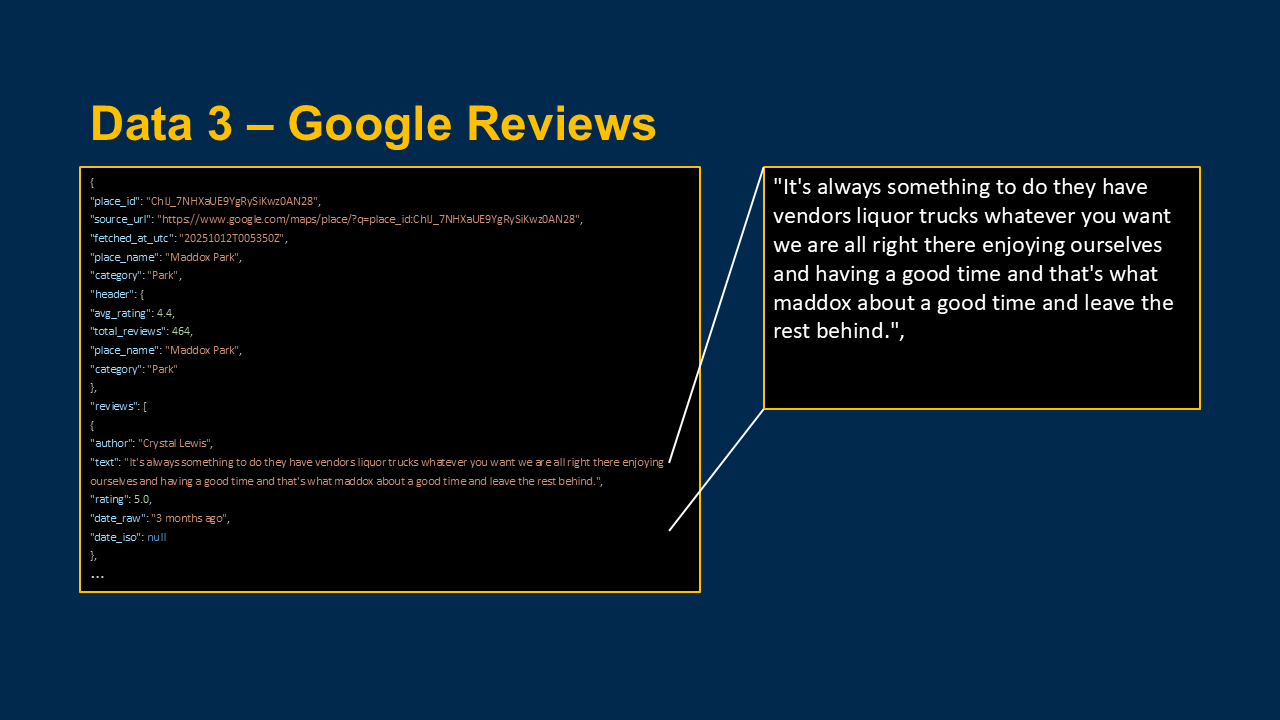
Building the Review Dataset
Collected structured review information including park name, reviewer text, rating, and date to create the raw material for sentiment analysis.
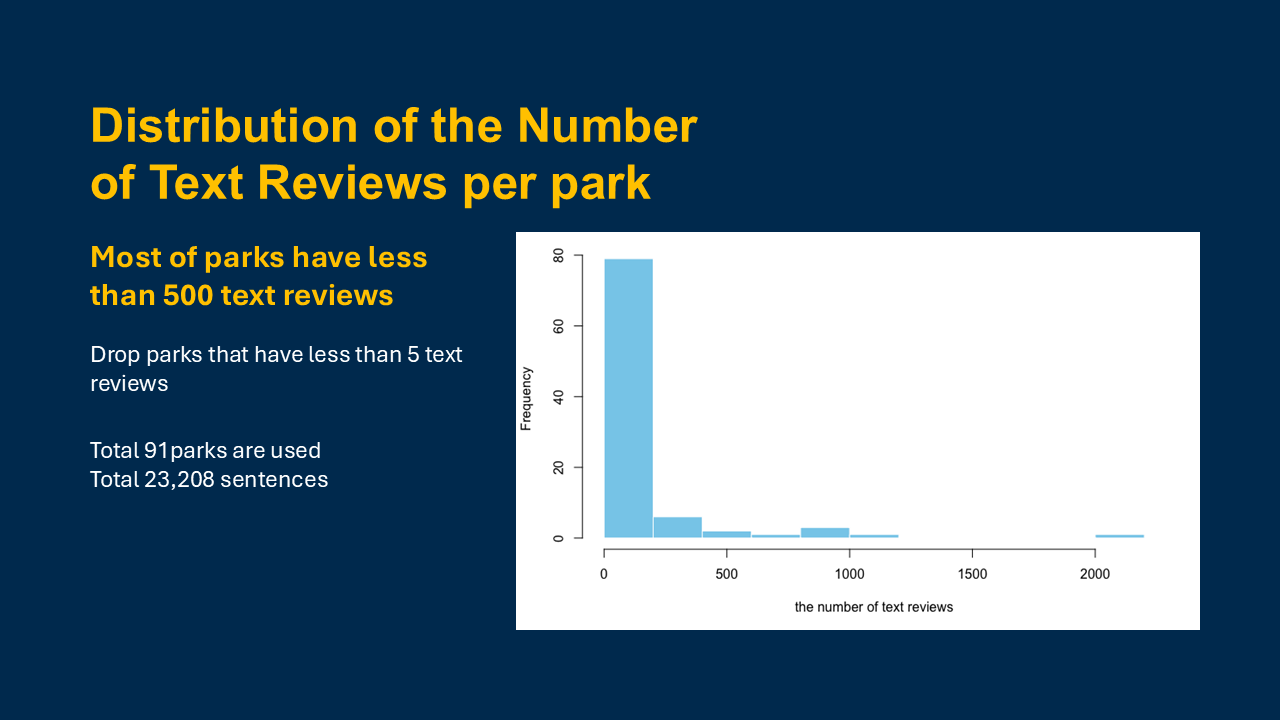
Slide 24 — Review Distribution
Slide 24 — Review Distribution

07
Preparing the Sentiment Dataset
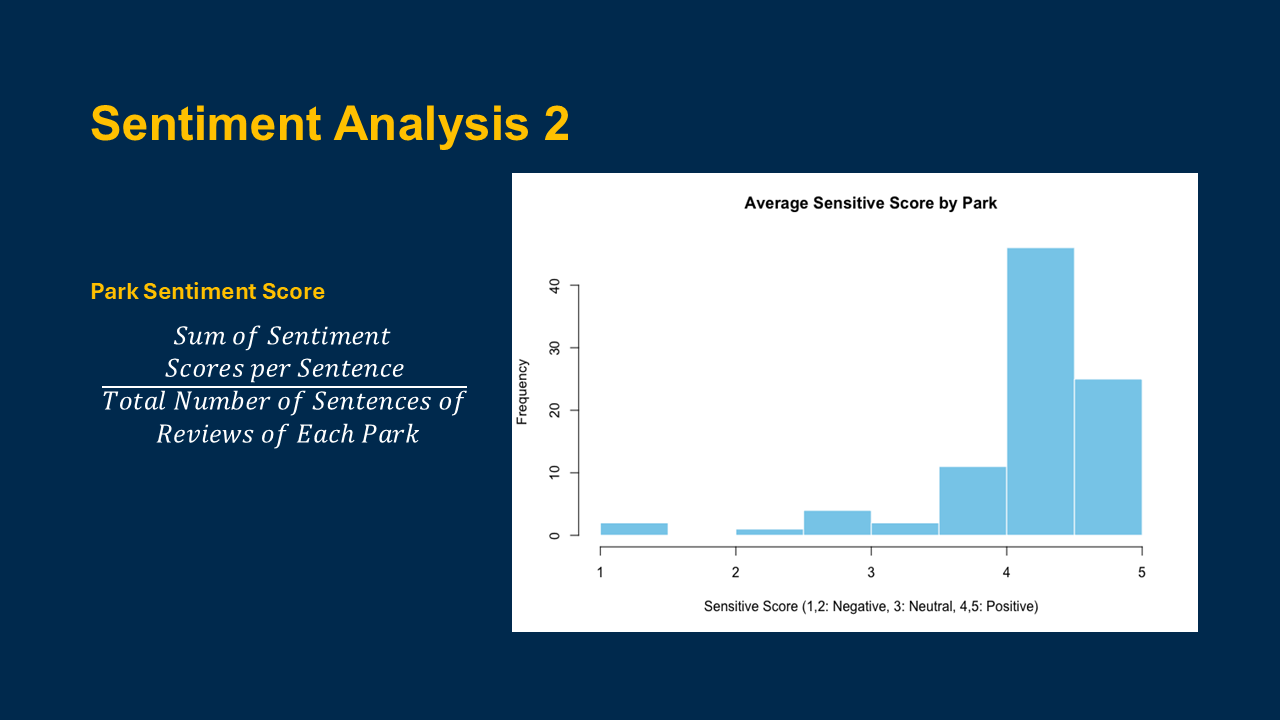
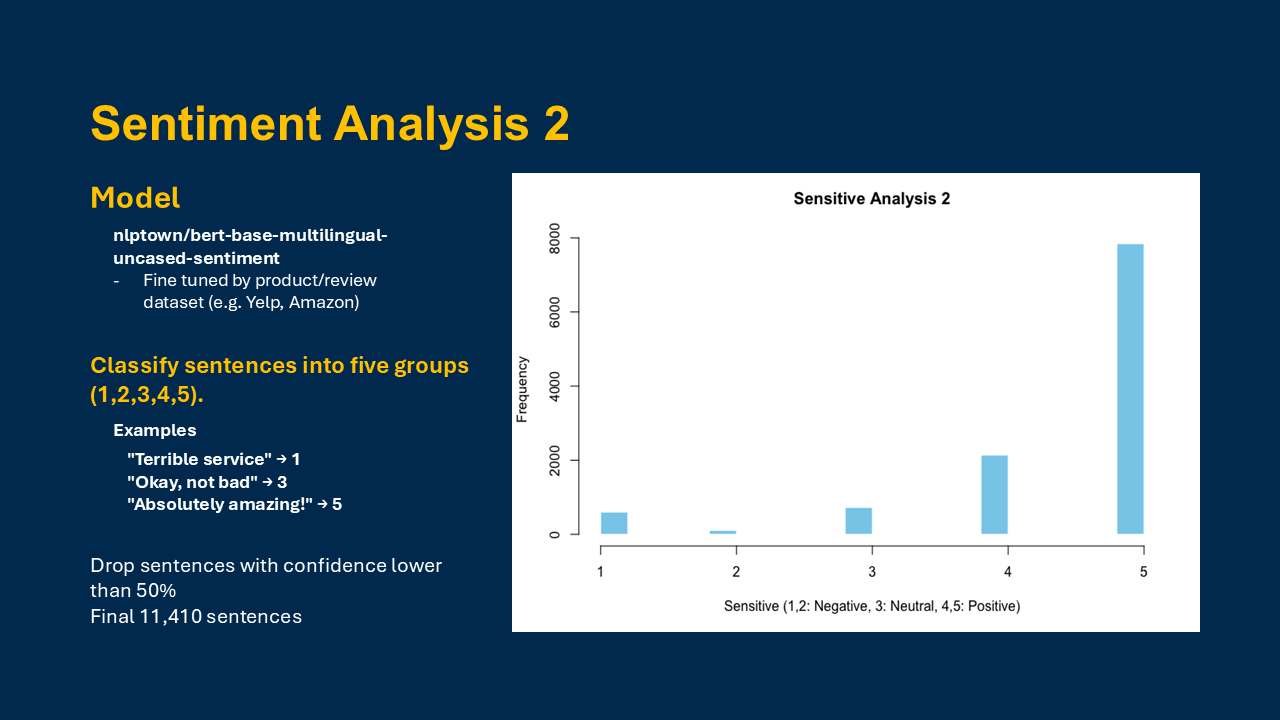
After applying minimum-review thresholds, the analysis retained 91 parks and 23,208 review sentences for sentiment processing.

08
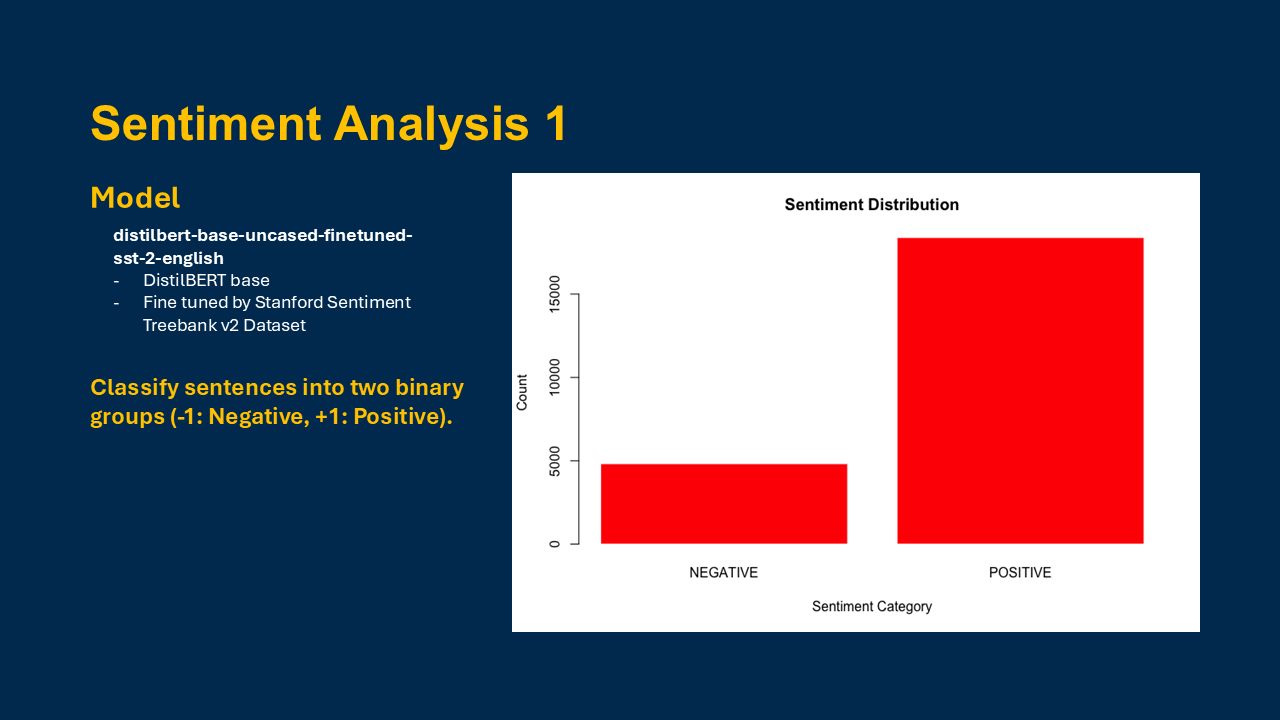
NLP Sentiment Classification
Applied pretrained language models to classify review sentiment and develop park-level sentiment scores, including confidence filtering to improve the reliability of the final measures.

09
Sentiment Analysis

10
Sentiment Analysis

11
Negative Binomial Modeling Framework
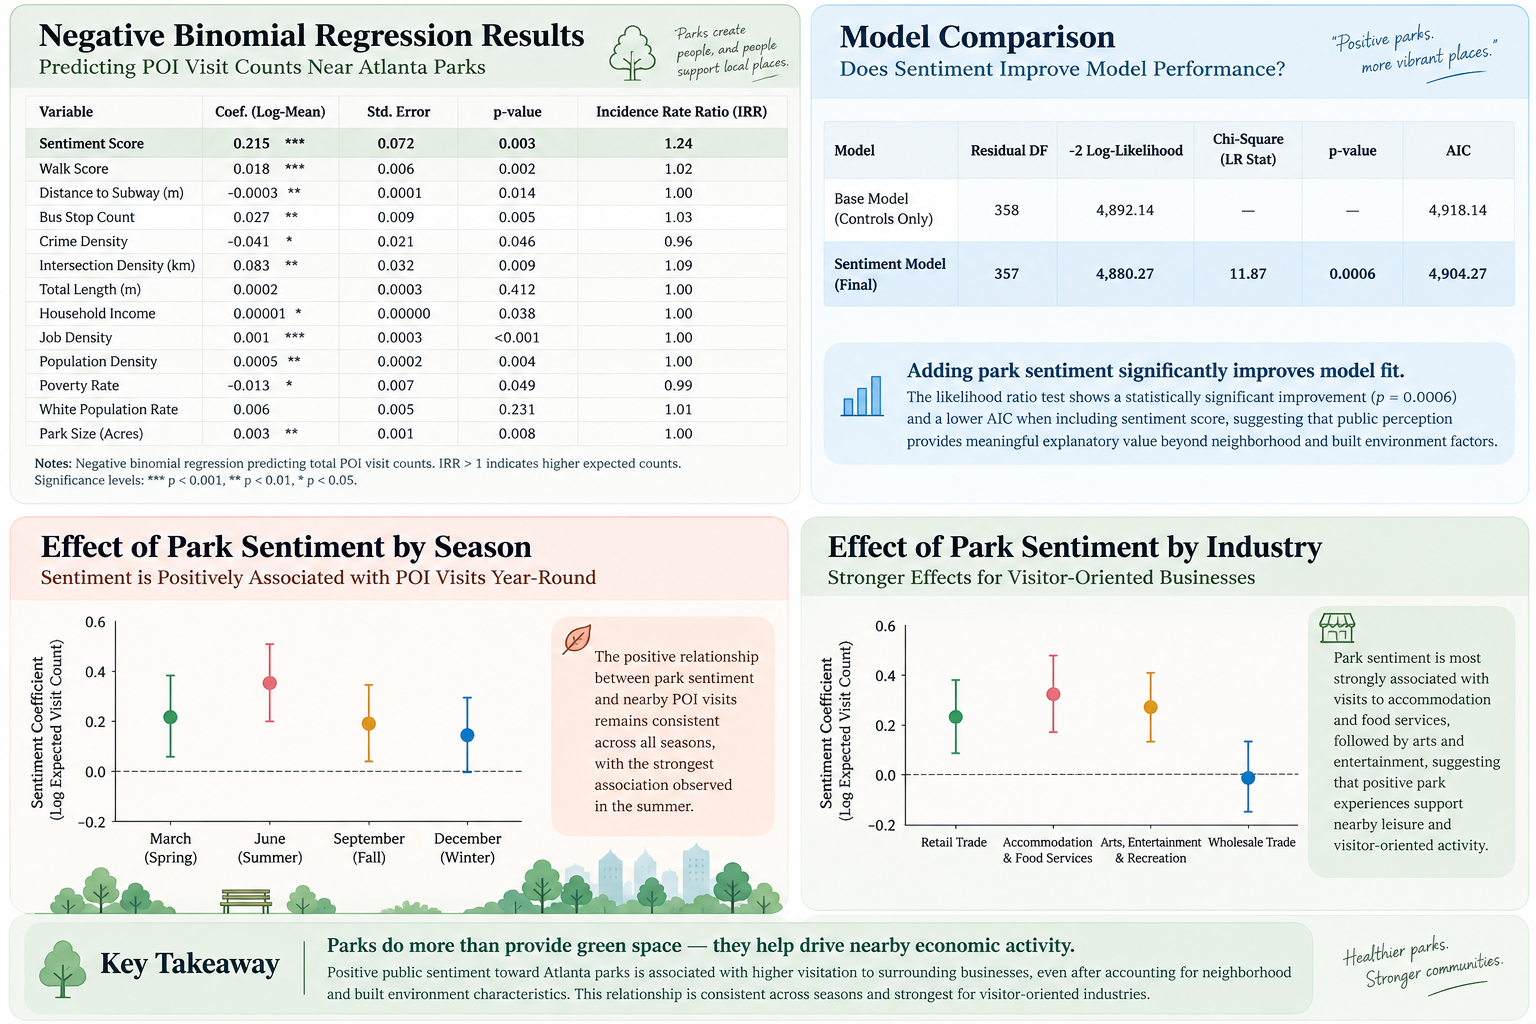
Modeled POI visit counts using negative binomial regression while controlling for Walk Score, transit access, crime, street-network characteristics, household income, job and population density, poverty, demographics, and park size.
Ran separate models for March, June, September, and December to test whether the relationship between park sentiment and nearby visitation changes throughout the year.
Compared sentiment effects across retail, arts and entertainment, and food and accommodation destinations to test whether park perception matters more for certain types of nearby activity.
- Research Questions
- Atlanta Park Study Area
- Spatial Sampling of Nearby Points of Interest
- Selecting Visitor-Oriented Business Categories
- Google Review Collection
- Building the Review Dataset
- Preparing the Sentiment Dataset
- NLP Sentiment Classification
- Sentiment Analysis
- Sentiment Analysis
- Negative Binomial Modeling Framework
bottom of page